R언어 시각화 통계 입문
동그랑땡의 github 자세히보기

R언어 2

R ggplot으로 Slope chart 만들기 geom_segment, geom_text(+ ggplot 한글 깨짐 현상 해결책)

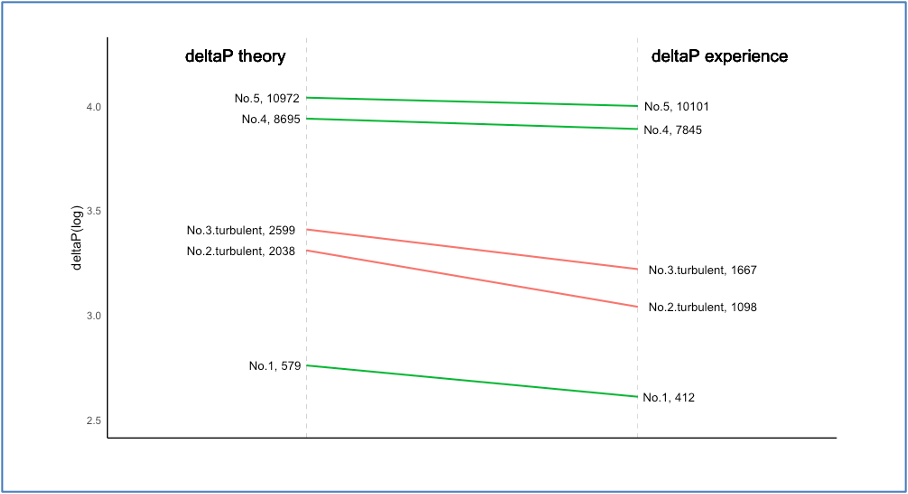
Slope Chart란? before after 차이가 있는 경우 그 차이를 간단하고 명확하게 보여주기 위해 사용한다. 나의 경우, 이론값과 실험값의 차이와 그 경향을 보여주기 위해 사용했다. 그러나, 대게 timeline 상에서 변화를 보여주기 위해 많이 사용한다. 아래 예시가 slope graph의 좋은 예시이다. 아무튼 본 포스팅은 아래 그래프를 만드는 과정을 담았다. ggplot, scales 라이브러리 사용 본 포스팅에선 Slope chart를 ggplot, scales 라이브러리를 이용하여 만든다. 혹시나 library가 없다면 미리 패키지를 설치하길 바란다. install.packages("tidyverse") install.packages("scales") library(ggplot2) l..

R 스튜디오 맥 "clipboard" 기능 안된다면! X11 module 오류 해결법

R로 갖고오고 싶은 엑셀 내용을 드래그 복사한 후 data1 = read.table("clipboard",h=T) 아래와 같이 "clipboard"를 활용하여 변수에 넣으려고 했는데 오류가 떴다. data1 = read.table("clipboard",h=T) Error in file(file, "rt") : X11 module cannot be loaded In addition: Warning message: In file(file, "rt") : unable to load shared object '/Library/Frameworks/R.framework/Resources/modules//R_X11.so': dlopen(/Library/Frameworks/R.framework/Resources/mod..

});